Anatomy of a VACUUM
Introduction
I recently had a customer who was trying to figure out why his VACUUM-for-wraparound was taking so long–he had a 6TB database, and the VACUUM had been running for over 4 days. It’s unfortunate that there’s no progress meter when VACUUMs run (especially when autovacuum kicked off a VACUUM in the background), but with a little help from vmstat and strace, and some wrangling with simple Bash commands like ls and ps, we can infer the progress and activity going on while VACUUM is running.
The Basics
Without too much detail, it’s important to know that a VACUUM in PostgreSQL consists of 3 phases:
- Ingest Phase – Dead tuples are read into
maintenance_work_mem. Ifmaintenance_work_memis exhausted, theVACUUMproceeds with the next two phases, then comes back to this phase and picks up where it left off. - Pruning Phase – Index entries pointing to dead tuples are removed.
- Cleanup Phase – Actual line pointers between item pointers and tuples in a data page are removed
If you think about a VACUUM in these terms, we can infer some behavioral patterns for each phase. Moreover, depending on which phase a VACUUM is in, getting impatient and hitting Ctrl-C may be counter-productive and somewhat risky.
Tracking the VACUUM
When trying to figure out what a VACUUM is doing at the moment, it’s very important to have the process ID of the psql session or vacuumdb process. You can easily get that with:
[root@server1 /]# ps aux | grep -v grep | grep -v "autovacuum launcher process" | grep -i vacuum
enterprisedb      14404  1.8 12.3 800152 253116 ?       Rs   00:20   0:01 postgres: enterprisedb edb [local] VACUUM
In this example, the VACUUM command is being run by a psql session with PID 14404. Keep this PID in handy so that you can figure out which files are being touched by this process.
Deciphering the Data
Note that Phase 1 (the Ingest Phase) is all about reading data into memory. It’s a scan of each file related to a table (if the on-disk footprint is greater than 1GB, a file gets split up into 1GB segments). As such, if you’re watching vmstat, you’ll probably see a fair amount of activity in the bi column of the io section–you may also see some iowait (the wa column under the cpu section). The cache column of the memory section should steadily increase up to the point of your maintenance_work_mem setting (plus whatever was in the cache prior to starting the VACUUM process). The free column of the memory section should steadily decrease as well.
Once all a table’s dead tuples are read into memory (or when maintenance_work_mem gets exhausted), the VACUUM process moves on to Phase 2 (the Pruning Phase). Here, you’ll see write activity against an index’s file(s). You should see some activity in bo of the io column as this is happening. To determine that it’s disk activity on an index, you’ll need to perform a brief strace against the processID of the VACUUM session. You’ll also need a mapping of indexes to tables, which you can get with the following query:
SELECT c.relname table_name, c.relfilenode table_file_basename, i.relname index_name, i.relfilenode index_file_basename
FROM pg_stat_user_indexes m
JOIN pg_class c ON m.relid=c.oid
JOIN pg_class i ON m.indexrelid = i.oid;
Note: this does not map to TOAST tables and their indexes (this is left as an exercise for the reader).
Once you’ve got a sampling of strace output, you can proceed to figure out which by mapping the file descriptor in strace to the file linked in /proc/<vacuum_processID>. The file it’s pointing to–if it’s an index, you’re on Phase 2.
[root@server /]# strace -p 14404
Process 14404 attached
write(515, "\0\0\0\0\0\0\0\0\0\0\0\0\0\0\0\0\0\0\0\0\0\0\0\0\0\0\0\0\0\0\0\0"..., 8192) = 8192
lseek(515, 0, SEEK_END)                 = 1458176
write(515, "\0\0\0\0\0\0\0\0\0\0\0\0\0\0\0\0\0\0\0\0\0\0\0\0\0\0\0\0\0\0\0\0"..., 8192) = 8192
lseek(515, 0, SEEK_END)                 = 1466368
write(515, "\0\0\0\0\0\0\0\0\0\0\0\0\0\0\0\0\0\0\0\0\0\0\0\0\0\0\0\0\0\0\0\0"..., 8192) = 8192
write(508, "\0\0\0\0x#T\34\0\0\0\0\220\0\300\0\0 \4 \0\0\0\0\340\2358\4`\235\376\0"..., 8192) = 8192
In the above strace example, 515 and 508 are file descriptors. Do ls -l /proc/14404/ | grep 515 and ls -l /proc/14404/ | grep 508 to see which files are actually being accessed.
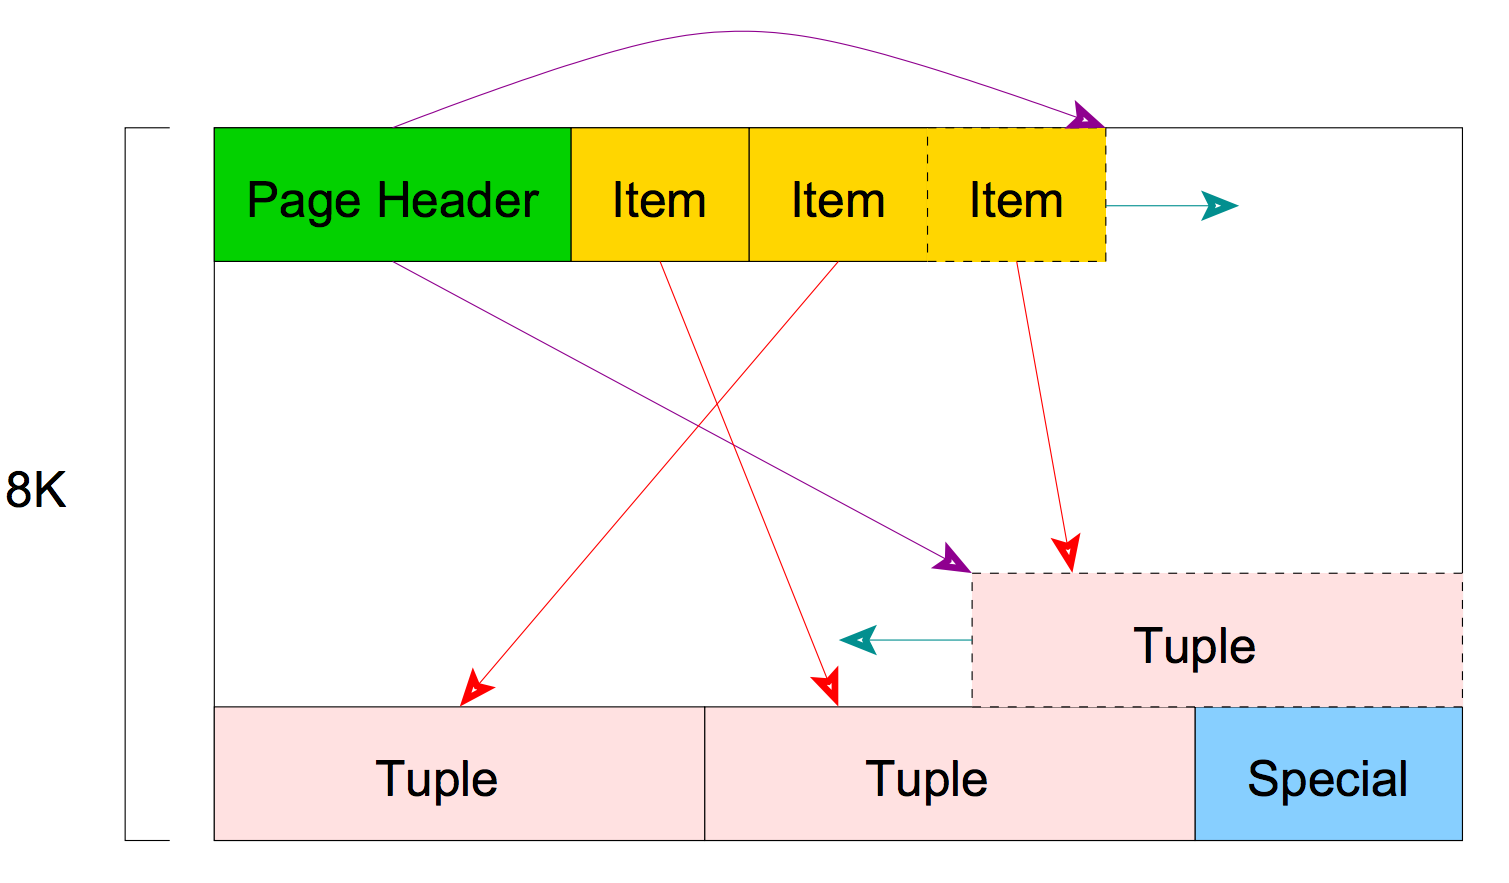
When a VACUUM is done with Phase 2, it moves on to Phase 3 (the Cleanup Phase), where it cuts the links between items and tuples on a disk page. If you don’t recall what a disk page looks like, an image is provided below. Note the red lines–Phase 3 removes the red lines and pink boxes (only if they’re marked as dead), and updates the green box to point to an available yellow box.
Phase 3 is the most significant part of the VACUUM process, and actually completes the work of freeing up space. It’s imperative not to abort this phase (and it’s probably not good to abort Phase 2 either), as you’ll have to re-do a lot of the legwork accomplished in the earlier phases.
To see if you’re on Phase 3, you’ll see a lot of write activity in vmstat. On a server with nothing else running besides Postgres, you should see high numbers in the bo column, and nearly zero in the bi column of the io section. Once Phase 3 is done, VACUUM will move on to the next table (or continue on the current table if Phase 1 filled up maintenance_work_mem). Once all tables are VACUUMed, the VACUUM process is done.
Conclusion
That’s about it, in a nutshell. Note that this is all that happens for a regular VACUUM. A VACUUM ANALYZE will perform an ANALYZE after each table is done getting VACUUMed. Also, for a VACUUM FULL, the behavior is slightly different, since the indexes get discarded, and the entire file gets re-written in a new location. Perhaps those details may be explained in a future post.
References
- PostgreSQL Internals Through Pictures - Presentation on PostgreSQL internals by Bruce Momjian